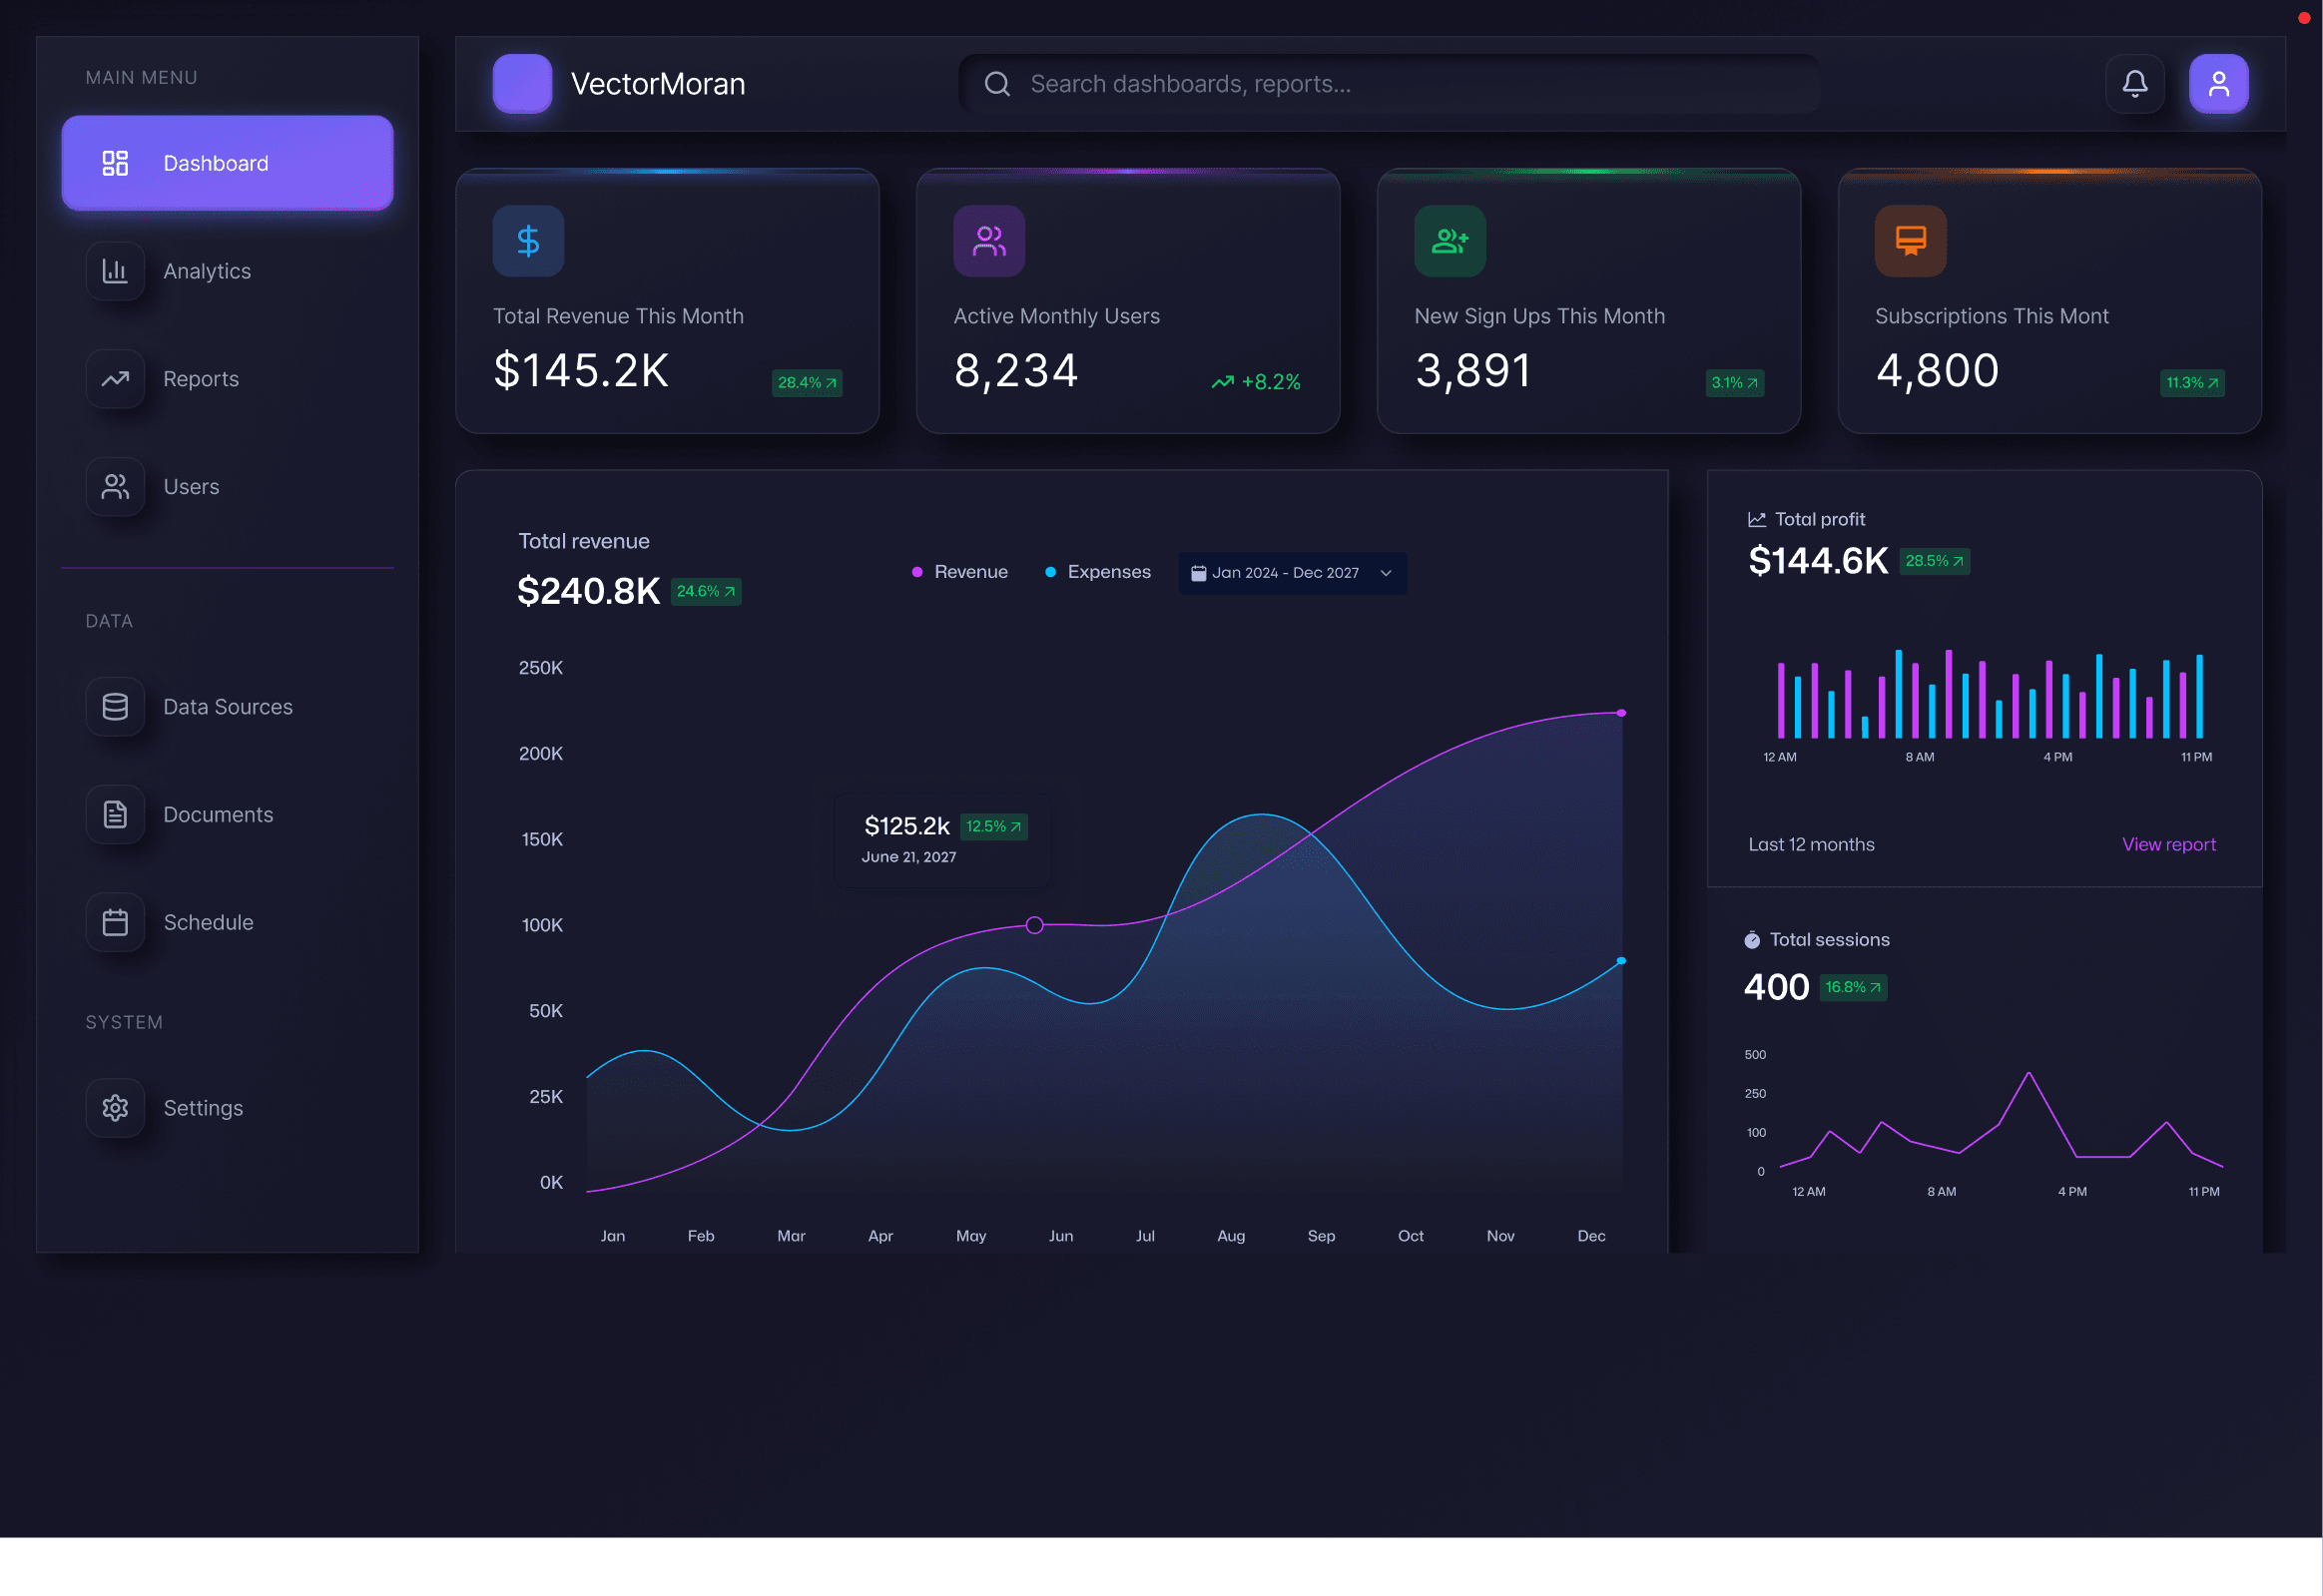
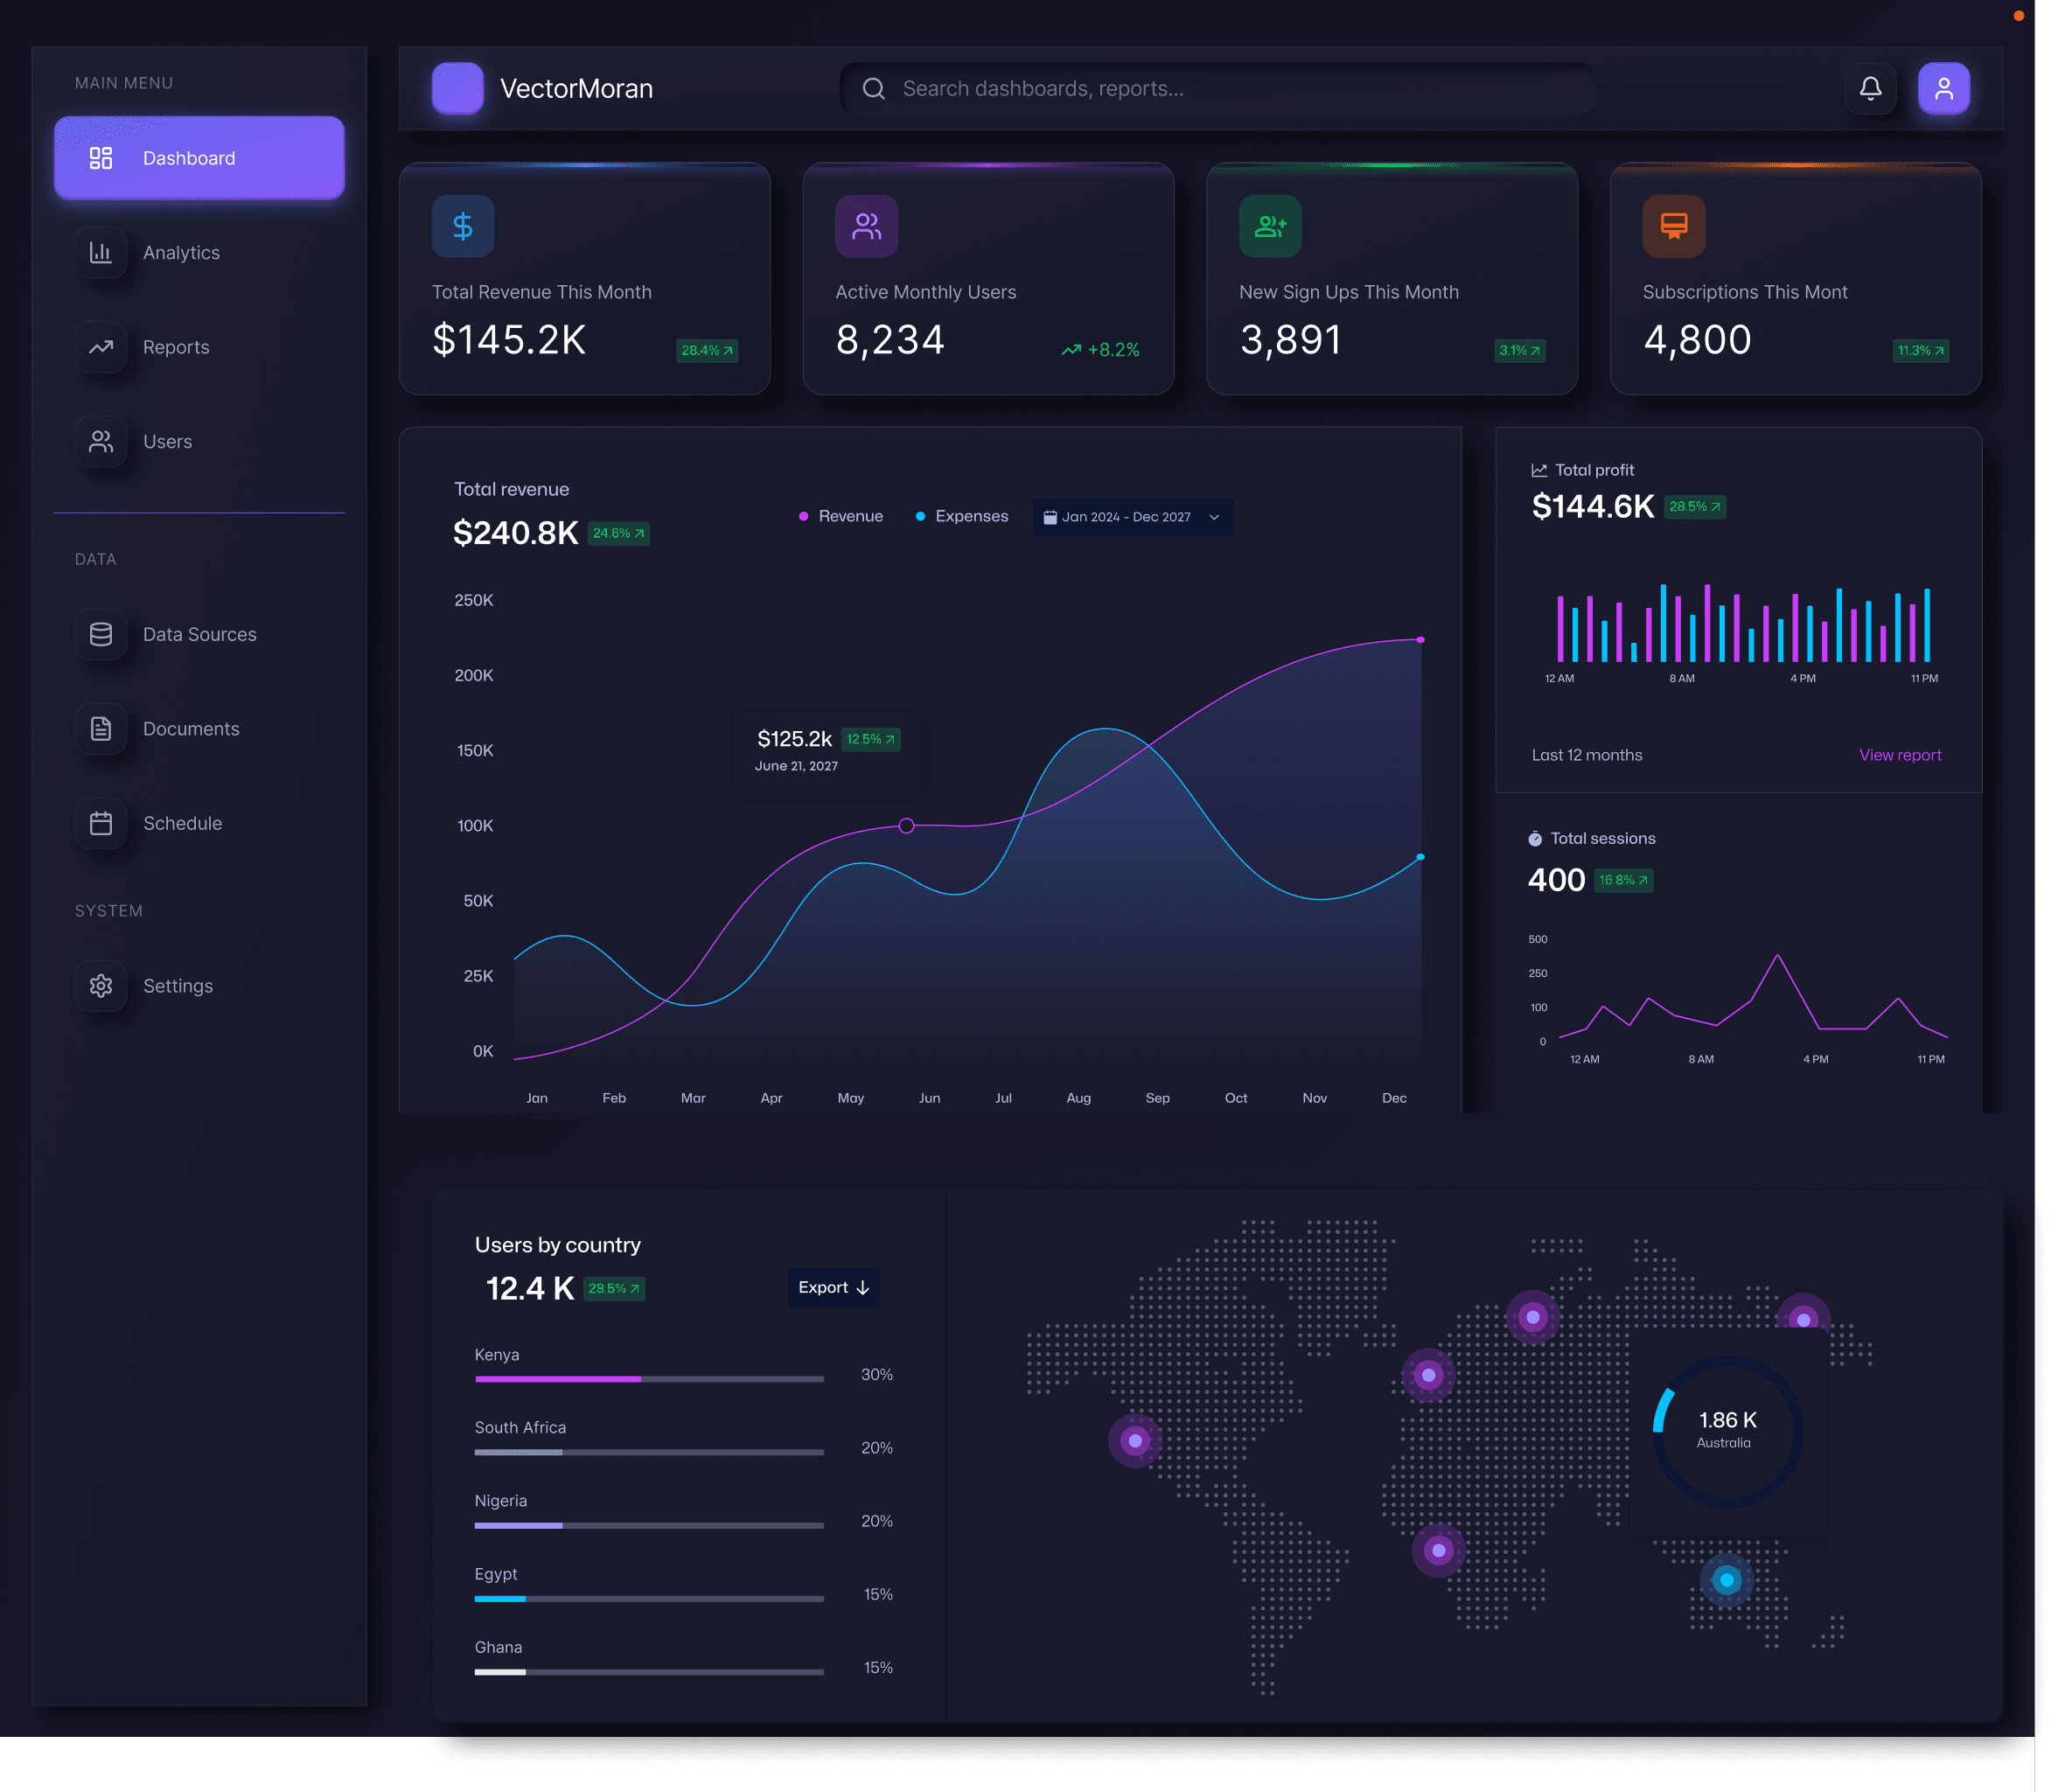
High-Performance Systems for High-Growth Companies
Bring clarity to your financial data with real-time charts, AI insights, and effortless collaboration.
Voltra.com
Trusted by by teams in Nairobi, Johannesburg, Dubai, and London
PROBLEM
Most Product Teams Are Slowed Down by Broken Systems
Innovative tools and powerful insights designed to elevate your business
Inconsistent Interfaces
Different pages, styles, and components create confusion for users and slow down development teams.
Design and Code Disconnect
Designs often look great in Figma but lose quality or logic when translated into production.
Data Without Clarity
Many dashboards show information but fail to deliver clear insights that teams can act on quickly.
SOLUTION
We Build Systems That Scale and Perform
Unified Design Systems
Reusable components and design tokens create consistency, reduce design debt, and speed up delivery.
Figma to Production Workflow
Every screen is designed with engineering in mind, ensuring faster handoff and cleaner implementation.
Insight Driven Dashboards
We structure information to help teams make faster decisions, not just view data.
Production Code
Clean, responsive React/Vue code that matches the design pixel-perfectly.

SPECIALIZATION
WHAT WE SPECIALIZE IN
Design Systems & Component Libraries
We build the "Source of Truth" for your brand. Atomic design structures that ensure consistency across every platform and device.
Enterprise Dashboards & CRM
Transforming complex data into intuitive interfaces. High-utility systems where clarity and speed matter most.
Product Engineering (Figma to Code)
We deliver the frontend. Clean, responsive, optimized code in React, Vue, or your preferred stack.
Smart Analytics
Real-Time Collaboration
MVP 1 Prioritization

PROBLEM
Most Product Teams Are Slowed Down by Broken Systems
Most Product Teams Are Slowed Down by Broken Systems
Different pages, styles, and components create confusion for users and slow down development teams.
Design and Code Disconnect
Designs often look great in Figma but lose quality or logic when translated into production.
Data Without Clarity
Many dashboards show information but fail to deliver clear insights that teams can act on quickly.
SOLUTION
We Build Systems That Scale and Perform
Unified Design Systems
Reusable components and design tokens create consistency, reduce design debt, and speed up delivery.
Figma
very screen is designed with engineering in mind, ensuring faster handoff and cleaner implementation.
Insight Driven Dashboards
We structure information to help teams make faster decisions, not just view data.
Production Code
Clean, responsive React/Vue code that matches the design pixel-perfectly.
Get Free Quote
SPECIALIZATION
WHAT WE SPECIALIZE IN
Design Systems & Component Libraries
We build the "Source of Truth" for your brand. Atomic design structures that ensure consistency across every platform and device.
Enterprise Dashboards & CRM
Transforming complex data into intuitive interfaces. High-utility systems where clarity and speed matter most.
Product Engineering (Figma to Code)
We deliver the frontend. Clean, responsive, optimized code in React, Vue, or your preferred stack.
Smart Analytics
Real-Time Collaboration
Task Prioritization
Get Free Quote
Data View
Scattered
data into visual insights
Scattered
data into visual insights
We bring flexibility to your analysis. From detailed tables to dynamic charts, visualize your data exactly the way your business needs.
We bring flexibility to your analysis. From detailed tables to dynamic charts, visualize your data exactly the way your business needs.
Total Users
3.01 K
Vs Last Month
2.87 K
10 Jan
10 Feb
Today
Line Chart
Track growth, performance, and change over time with clear trend lines that highlight what truly drives progress.
Bar Chart
Compare categories and totals side by side. Perfect for visualizing revenue, expenses, and goal achievements.
Dubai
London
Kenya
January
February
March
Scatter Chart
Explore relationships between metrics. Identify correlations, patterns, and outliers with precision and depth.
Lahore
Islamabad
Multan
10
20
30
40
50
Pie Chart
Break down proportions with clarity. See how each segment contributes to your overall financial performance.
Lagos
54.9%
Nairobi
17.64%
Capetown
27.46%
Scatter Chart
Explore relationships between metrics. Identify correlations, patterns, and outliers with precision and depth.
Lahore
Islamabad
Multan
10
20
30
40
50
Area Chart
Show cumulative trends over time. Highlight growth, progress, and volume in a clear, layered visual format.
Vancouver
Toronto
Vancouver
10
20
30
40
50
Heat Map
Spot patterns instantly. Visualize performance intensity across categories and detect what needs your attention.
Total Hours
346h 36m
Jan
Feb
Mar
Apr
May
Jun
Robust features
Powerful features
for data driven decisions.
Powerful features
for data driven decisions.
Vector Moran works toward making financial insight effortless. Automates busywork, keeps your data safe, and gives your team the clarity to act fast.
Vector Moran works toward making financial insight effortless. Automates busywork, keeps your data safe, and gives your team the clarity to act fast.

Revenue Surge Detected
10:11 am
Sales revenue grew 12.4% compared to last week primarily from Vancouver region.
Revenue Surge Detected
10:11 am
Sales revenue grew 12.4% compared to last week primarily from Vancouver region.
Profit Target Hit
10:11 am
Profit margin reached 26%, 3 days ahead of plan.
Expense Increase
03:11 pm
Operations spending rose 18% MoM. Check vendor invoices.
Expense Increase
03:11 pm
Operations spending rose 18% MoM. Check vendor invoices.
Profit Target Hit
08:36am
Profit margin reached 26%, 3 days ahead of plan.
Smart Notifications
Get notified when spending spikes, revenue goals are hit, or forecasts shift, in-app, by email, or Slack.
Revenue Surge Detected
10:11 am
Sales revenue grew 12.4% compared to last week primarily from Vancouver region.
Revenue Surge Detected
10:11 am
Sales revenue grew 12.4% compared to last week primarily from Vancouver region.
Profit Target Hit
10:11 am
Profit margin reached 26%, 3 days ahead of plan.
Expense Increase
03:11 pm
Operations spending rose 18% MoM. Check vendor invoices.
Expense Increase
03:11 pm
Operations spending rose 18% MoM. Check vendor invoices.
Profit Target Hit
08:36am
Profit margin reached 26%, 3 days ahead of plan.
Smart Notifications
Get notified when spending spikes, revenue goals are hit, or forecasts shift, in-app, by email, or Slack.
Bank Level Security
Your data stays private and protected with end-to-end encryption and compliance at every level.
Revenue Surge Detected
10:11 am
Sales revenue grew 12.4% compared to last week primarily from Vancouver region.
Revenue Surge Detected
10:11 am
Sales revenue grew 12.4% compared to last week primarily from Vancouver region.
Profit Target Hit
10:11 am
Profit margin reached 26%, 3 days ahead of plan.
Expense Increase
03:11 pm
Operations spending rose 18% MoM. Check vendor invoices.
Expense Increase
03:11 pm
Operations spending rose 18% MoM. Check vendor invoices.
Profit Target Hit
08:36am
Profit margin reached 26%, 3 days ahead of plan.
Bank Level Security
Your data stays private and protected with end-to-end encryption and compliance at every level.
Universal Search
Find anything in seconds transactions, dashboards, datasets, or people. Our search is context aware of your dashboard.
Multan
Id
75486
75487
75488
75489
75490
City
Lahore
Multan
Islamabad
Krachi
Bahawalpur
Transactions
1.2K
1.8K
3.7K
8.9K
4.8K
Amount
$38.52K
$42.83K
$87.26K
$156.85K
$96.66K
Revenue Surge Detected
10:11 am
Sales revenue grew 12.4% compared to last week primarily from Vancouver region.
Revenue Surge Detected
10:11 am
Sales revenue grew 12.4% compared to last week primarily from Vancouver region.
Profit Target Hit
10:11 am
Profit margin reached 26%, 3 days ahead of plan.
Expense Increase
03:11 pm
Operations spending rose 18% MoM. Check vendor invoices.
Expense Increase
03:11 pm
Operations spending rose 18% MoM. Check vendor invoices.
Profit Target Hit
08:36am
Profit margin reached 26%, 3 days ahead of plan.
Universal Search
Find anything in seconds transactions, dashboards, datasets, or people. Our search is context aware of your dashboard.
Integrations
We integrate the dashboards with the tools you already use — from Google Sheets and Notion to Xero, Stripe, and HubSpot.

Google Sheets
Import live spreadsheet data to visualize and analyze instantly.
Connecting
Google Sheets
Import live spreadsheet data to visualize and analyze instantly.

Zapier
Automate data syncs and workflows across 5,000+ business apps.

Airtable
Link structured business data and create flexible dashboards in minutes.
Revenue Surge Detected
10:11 am
Sales revenue grew 12.4% compared to last week primarily from Vancouver region.
Revenue Surge Detected
10:11 am
Sales revenue grew 12.4% compared to last week primarily from Vancouver region.
Profit Target Hit
10:11 am
Profit margin reached 26%, 3 days ahead of plan.
Expense Increase
03:11 pm
Operations spending rose 18% MoM. Check vendor invoices.
Expense Increase
03:11 pm
Operations spending rose 18% MoM. Check vendor invoices.
Profit Target Hit
08:36am
Profit margin reached 26%, 3 days ahead of plan.
Integrations
We integrate the dashboards with the tools you already use — from Google Sheets and Notion to Xero, Stripe, and HubSpot.
Smart Insights
Everything you need
to understand your data.
Everything you need
to understand your data.
Stay ahead of targets by tracking performance, forecasting cash flow, and managing expenses in a single, streamlined view.
Stay ahead of targets by tracking performance, forecasting cash flow, and managing expenses in a single, streamlined view.
Automated Reporting
We turn raw transactions into ready-to-share summaries. Generate insights, daily, weekly, or on demand.
Money Raised
Jan 01 - Mar 15
$34,678.34 K
Total Amount
Get Report
15 Jan
15 Feb
15 Mar
Value by source
Loan SBA
27%
$7000.00
Seller Note
24%
$6653.00
Seller Note
20%
$1534.00
Class A Client
16%
$1103.00
Class B Client
13%
$896.00
Smart Spending Insights
Spot unusual patterns, forecast spending, and stay under limits with clear visuals that make complex data instantly readable.
Spending
See your stores performance from 10 Jan- 24 Feb
Stores Projected Goals
Min Sales
400
orders
Refunds
50<
refund
PR Sales
400
orders
Custom Rules
Create flexible rules that automate key actions, reduce manual effort, and keep every workflow running smoothly.
Predictive Trends
Identify shifts early with smart forecasting that reveals patterns, highlights risks, and helps guide better decisions.
Live Data
Work with real-time metrics that update instantly, keep your insights current, and support fast, confident actions.
Boost Productivity
Simplified for Clarity
Simplified for Clarity
Every detail is built for speed, precision, and confidence, helping you make smarter business decisions, faster.
Every detail is built for speed, precision, and confidence, helping you make smarter business decisions, faster.
Built for Speed
Engineered to respond instantly, load heavy data smoothly, and keep every interaction fast no matter how complex your workflow becomes.
Built for Speed
Engineered to respond instantly, load heavy data smoothly, and keep every interaction fast no matter how complex your workflow becomes.
Analyze Together
Invite your team into the same figma file to, comment, collaborate and make decisions together
Transactions
Id
75486
75487
75488
75488
75490
75490
75490
75490
Date
04/11/2025
05/12/2025
16/11/2025
20/08/2025
07/07/2025
12/03/2025
23/06/2025
05/07/2025
Date
Lahore
Multan
Islamabad
Krachi
Pindi
Sadiqabad
Faisalabad
Gujrat
Amount
$38.52K
$42.83K
$87.26K
$156.85K
$96.66K
$42.83K
$38.52K
$87.26K
You
Anwar
Reviews
Real results from real teams
Real results from real teams
Teams across industries rely on Vectormoran to move faster, collaborate better, and understand their data in real time.
Teams across industries rely on Voltra to move faster, collaborate better, and understand their data in real time.
"Voltra changed how our team tracks performance. The speed and visual clarity are unmatched — it’s become our daily command center."

Sarah Lin
CFO, Northview Capital
"We replaced four dashboards with Voltra. Reporting that used to take half a day now takes ten minutes."

Omar Rizvi
Head of Finance, Gridbase
"Our finance reviews are smoother than ever. Everyone’s looking at the same live data — it keeps meetings focused."

Hannah Wells
Head of Operations, Kinetic
"The interface just flows. You move from metrics to insights naturally — it feels built for the way we think."

Jasper Lee
Director of Strategy, Ventra
"The dashboard feels alive. Every update is instant, and I never have to worry about syncing or missing data again."

Ella Donovan
Financial Analyst, Luma
"The live collaboration feels effortless. It’s the first time our team can explore data together without slowing down."

David Kline
COO, UrbanScope
"I love how fast everything loads. The insights feel effortless, even with thousands of rows of data behind them."

Maria Santos
Controller, Brightbeam Inc.
"Voltra became our single source of truth. Every number, every trend — always up to date and ready for presentation"

Noah Brooks
CEO, Brookwell Labs
"Voltra helped us centralize all our reports. What used to take three tools now happens seamlessly in one place."

Priya Malhotra
Finance Manager, Altura Tech
"Voltra gives us clarity across all departments. The accuracy and refresh speed are incredible for financial planning."

Leo Fernandez
Product Finance Lead, HorizonAI
"The real-time updates are a game changer. It’s like watching our business breathe — numbers move, and we react instantly."

Zoe Carter
Senior Analyst, Frame & Co.
"The automated alerts saved us more than once. We catch budget anomalies before they become problems."

Rafi Khan
Senior Accountant, Quantify
Show more
"Voltra changed how our team tracks performance. The speed and visual clarity are unmatched — it’s become our daily command center."
Sarah Lin
CFO, Northview Capital
"We replaced four dashboards with Voltra. Reporting that used to take half a day now takes ten minutes."
Omar Rizvi
Head of Finance, Gridbase
"Our finance reviews are smoother than ever. Everyone’s looking at the same live data — it keeps meetings focused."
Hannah Wells
Head of Operations, Kinetic
"The interface just flows. You move from metrics to insights naturally — it feels built for the way we think."
Jasper Lee
Director of Strategy, Ventra
"“The dashboard feels alive. Every update is instant, and I never have to worry about syncing or missing data again."
Ella Donovan
Financial Analyst, Luma
"The live collaboration feels effortless. It’s the first time our team can explore data together without slowing down."
David Kline
COO, UrbanScope
"I love how fast everything loads. The insights feel effortless, even with thousands of rows of data behind them."
Maria Santos
Controller, Brightbeam Inc.
"Voltra became our single source of truth. Every number, every trend — always up to date and ready for presentation"
Noah Brooks
CEO, Brookwell Labs
"Voltra helped us centralize all our reports. What used to take three tools now happens seamlessly in one place."
Priya Malhotra
Finance Manager, Altura Tech
"Voltra gives us clarity across all departments. The accuracy and refresh speed are incredible for financial planning."
Leo Fernandez
Product Finance Lead, HorizonAI
"The real-time updates are a game changer. It’s like watching our business breathe — numbers move, and we react instantly."
Zoe Carter
Senior Analyst, Frame & Co.
"The automated alerts saved us more than once. We catch budget anomalies before they become problems."
Rafi Khan
Senior Accountant, Quantify
Show more
FAQ
Frequently asked questions
Frequently asked questions
Get answers to most common questions about Voltra, its features and how to make most of our powerful finance dashboard.
Get answers to most common questions about Vector Moran, its features and how to make most of our powerful finance dashboard.
Who is Vector Moran and what do you do
We are a systems design studio that helps growing companies design and build scalable dashboards, design systems, and product interfaces. From Figma architecture to production ready UI, we create digital systems that improve clarity, speed, and long term consistency.
Can you work with our existing product and development team
Yes. Most of our projects involve collaborating with in-house developers or external engineering teams. We design with implementation in mind and deliver structured files, reusable components, and documentation that fits directly into your workflow.
How long does a typical project take
Most dashboard and system design projects take between two and four weeks depending on scope. Design system foundations can be built faster, while larger platforms may run longer. We work in clear milestones so progress is always visible.
Do we own the designs and code after delivery
Yes. You receive full ownership of the design files, component systems, and deliverables. There is no lock-in. Your team can continue building and scaling confidently after handover.
Do you work with international clients
Absolutely. We work with teams across Africa, the Middle East, and beyond. We use clear communication, async updates, and timezone-flexible processes to keep collaboration smooth regardless of location.
What happens after the project is completed
After delivery, we provide support to help your team implement or extend the system. Many clients continue with us for ongoing improvements, new features, or design system expansion as the product grows.
How do you handle sensitive or confidential data
We design with privacy and security in mind. We do not require access to sensitive production data, and any materials shared with us are handled confidentially. We are comfortable working under NDAs and follow structured workflows that protect client information throughout the design and handoff process.
WHAT ARE YOU STILL WAITING FOR
Grow Now with Vector Moran
WHAT ARE YOU STILL WAITING FOR
Grow Now with VectorMoran